Almost half a million US dollars, about £250k, was earmarked by the National Science Foundation (NSF) for a project to map California’s San Andreas Fault; the project will be completed within the next few weeks and could radically improve earthquake prediction in this region.
Engineers with the University of Florida (UF), the University of California, Berkeley (UCB), who operate the National Center for Airborne Laser Mapping (NCALM), and other centres will complete a two-year effort to produce the most detailed-ever map of the almost 2000 km fault and its immediate surroundings. The map will provide a baseline against which future earth movements can be compared allowing much faster surveys to be carried out after an earthquake and so provide invaluable information for predictive computer models of the region.
Fault mapping
We’re making it possible to get very accurate data on how much the earth around the fault is displaced during an earthquake, explains UF civil engineering professor Ramesh Shrestha, Seismologists can quantify that information and input it into their equations and models and ultimately try to better predict earthquakes.
Shrestha and fellow UF professor of civil engineering Bill Carter were among the earliest researchers to apply the airborne laser swath mapping technique at the heart of the project, to detect changes in terrain caused by such natural events as hurricanes and earthquakes. In this method, a small aircraft carries a laser aimed at the ground, which emits as many as 167,000 pulses of light each second toward the ground. The accuracy drops off at the highest pulse rates Carter told us, so most of the mapping is being done at 100,000 pps, and in limited forested areas, we are using 125,000 pps The pulses are scattered back to an onboard sensor by the terrain and software pinpoints the altitude of each target point. The density of the points is as high as 10 to 15 data points per square metre, and each range is accurate to a few centimetres.

Professor William Carter
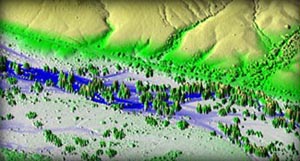
By combining this data with global positioning system (GPS) coordinates, the precise altitude, latitude and longitude of each identified point can be determined, allowing the team to construct a very accurate three-dimensional map of the region. The raw observations can be filtered to derive an image which has almost photographic clarity, but lacks distracting features such as trees and buildings.

Ramesh L. Shrestha
Historically, seismologists have recorded before and after maps of earthquake zones, but using traditional surveying tools this process is time-consuming and labour intensive. The laser swath approach is much faster, more detailed, and more accurate.
The first phase of mapping the San Andreas was proposed by Michael Bevis, of Ohio State University, a few years ago, explains Carter, He chose the southern portion, which included Palmdale and other areas where there is concern about major earthquakes. The team is currently carrying out the final survey, mapping the northern end of the San Andreas Fault closest to San Francisco. They point out that the same approach has been used to map the Colorado mountain snowpack and the alluvial fans of Death Valley.
The data from Bevis’ project is already in wide circulation and has surprised many of the user community with the accuracy and detail captured, Carter told us. The second phase of the funding, to complete the coverage, is also from NSF, but through the Plate Boundary Project, run by a consortium of universities, know as UNAVCO.
Further reading
Professor William Carter
http://www.ce.ufl.edu/people/faculty/alpha/carter.htm
The National Center for Airborne Laser Mapping
http://www.ncalm.ufl.edu/
Ramesh L. Shrestha’s homepage
http://www.ce.ufl.edu/people/faculty/alpha/shrestha.htm
Suggested searches
San Andreas fault
earthquakes